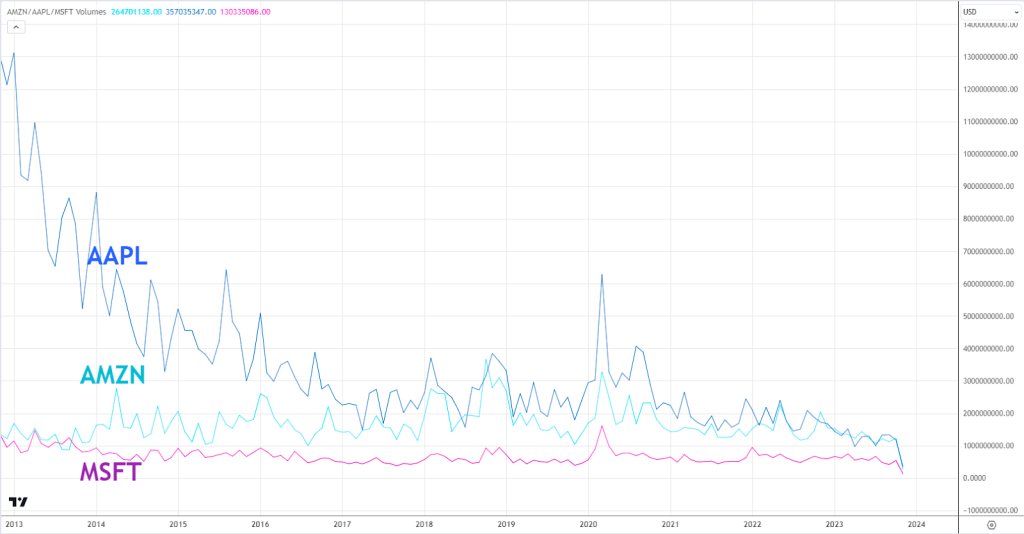
Engaging in stock market trading often resembles a casino, where each participant strives to win, trying to predict the change in stock prices. Among the critical factors determining the stock price dynamics is the concept trading volumes. Simply put, this indicator reflects the number of shares sold or bought during a trading session on the stock exchange. A substantial trading volume generally signifies heightened investor interest in a company’s shares, potentially resulting in an upswing in their prices. Conversely, a low trading volume may indicate waning investor interest, leading to a price drop.
Accordingly, the trading volume directly affects stock prices and is typically represented on charts through a volume indicator.
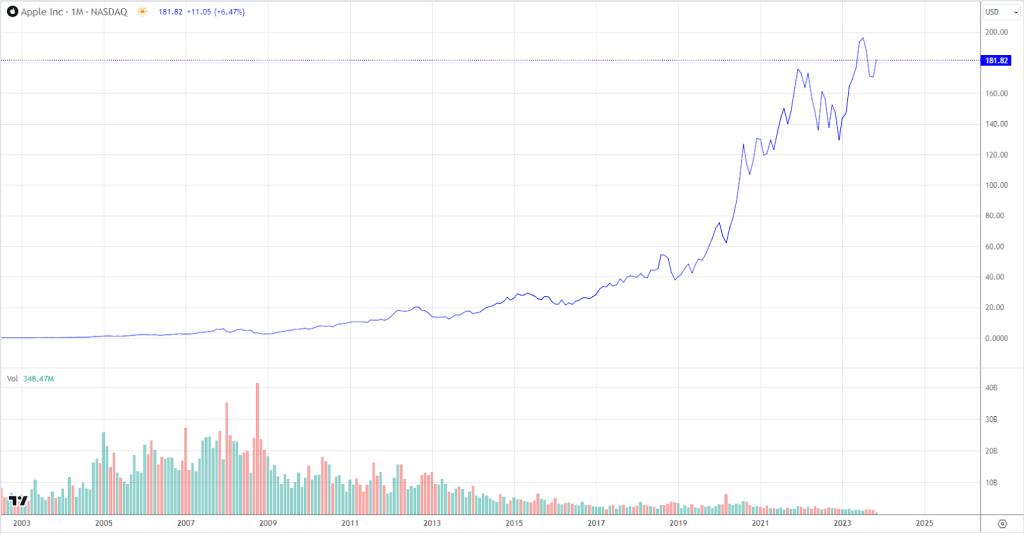
Consider the example of Apple (NASDAQ:AAPL). From 2003 to 2008, the trading volume of Apple shares more than doubled, contributing to increase in stock prices.This was attributed to increased demand for Apple products, as well as new products and innovations introduced by the company. The guys from Cupertino certainly know how to capture attention.
It’s noteworthy that in 2020, during the onset of the COVID-19 pandemic, Apple shares experienced a decline in trading volume, resulting in a 15% decrease in share prices for the year. This decline was linked to reduced market activity and a decrease in investor interest in technology companies in general. However, post-pandemic recovery saw the Apple stock price rebound, even though the trading volume did not fully return to previous levels.
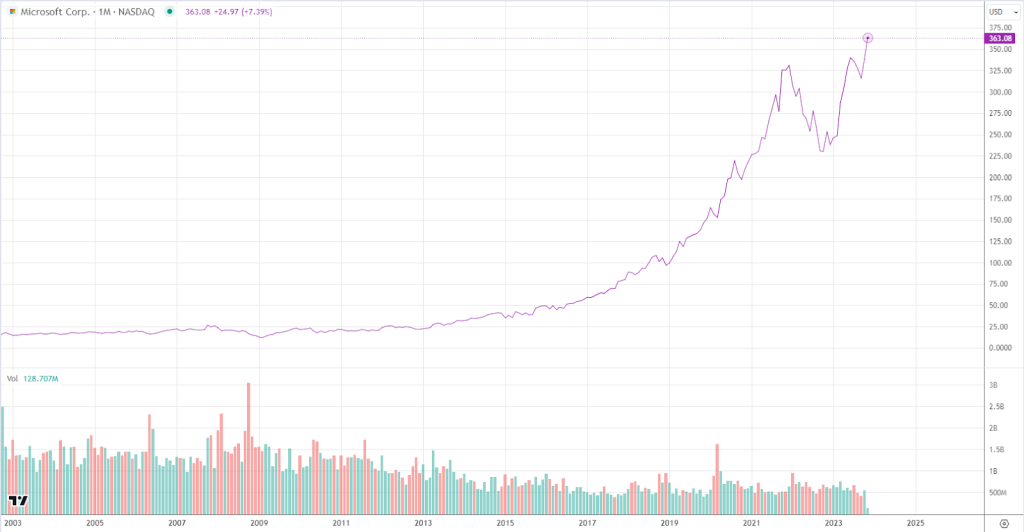
Another illustrative example is Microsoft (NASDAQ:MSFT). In the mid-2000s, Microsoft shares showed consistent growth, making them one of the most popular investment instruments among traders. During this period, the trading volume of Microsoft shares remained high, providing price stability. In 2008, amid the financial crisis, the shares of major technology companies, including Microsoft, witnessed a decline in value. This was partly due to a sudden surge in selling activity followed by a decrease in trading volumes, signaling a dip in investor interest during the period of market instability.
Although Microsoft’s current stock price is breaking records, trading volumes have remained relatively low. This can be explained by the challenges the high-tech sector has faced in recent years, prompting investors to shift to other industries and, at times, even different markets. Cryptocurrencies have gained almost half of private traders to their side.
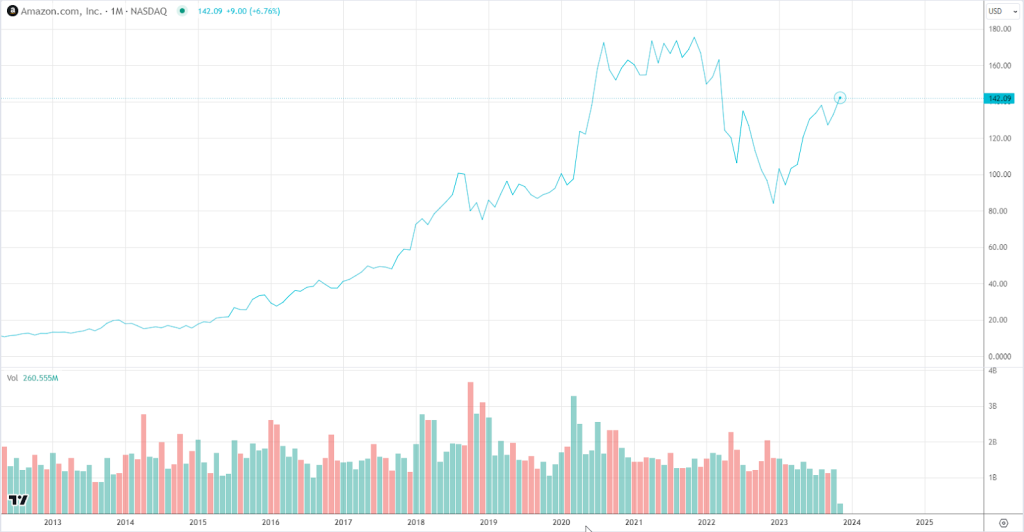
The story of Amazon (NASDAQ:AMZN) is similarly noteworthy. At the beginning of 2017, the company’s shares showed steady growth fueled by increased trading volumes and internal factors such as profit reports.However, akin to Apple, the COVID-19 pandemic resulted in reduced trading volumes and a subsequent decline in the price of Amazon shares. As market activity decreased and investor sentiment turned negative, volatility also diminished along with the share price. Yet, post-restrictions and economic recovery, Amazon’s stock price rebounded.
Examining the overall volume dynamics over the past decade reveals a decline, inversely correlated with prices. Hence, observing how new investors enter the stock market adds an interesting dimension. Below is a chart comparing the volumes of the considered companies.
